WALA graphs
We are learning that graphs can be pictures or diagrams that tell us information.
Creating different graphs.......
We wanted to get some new library books for our classroom. We created this graph to find out what types of books we wanted on our library shelf.

- What types of books do we like the most?
- What types of books do we like the least?
- What else does the graph show us?
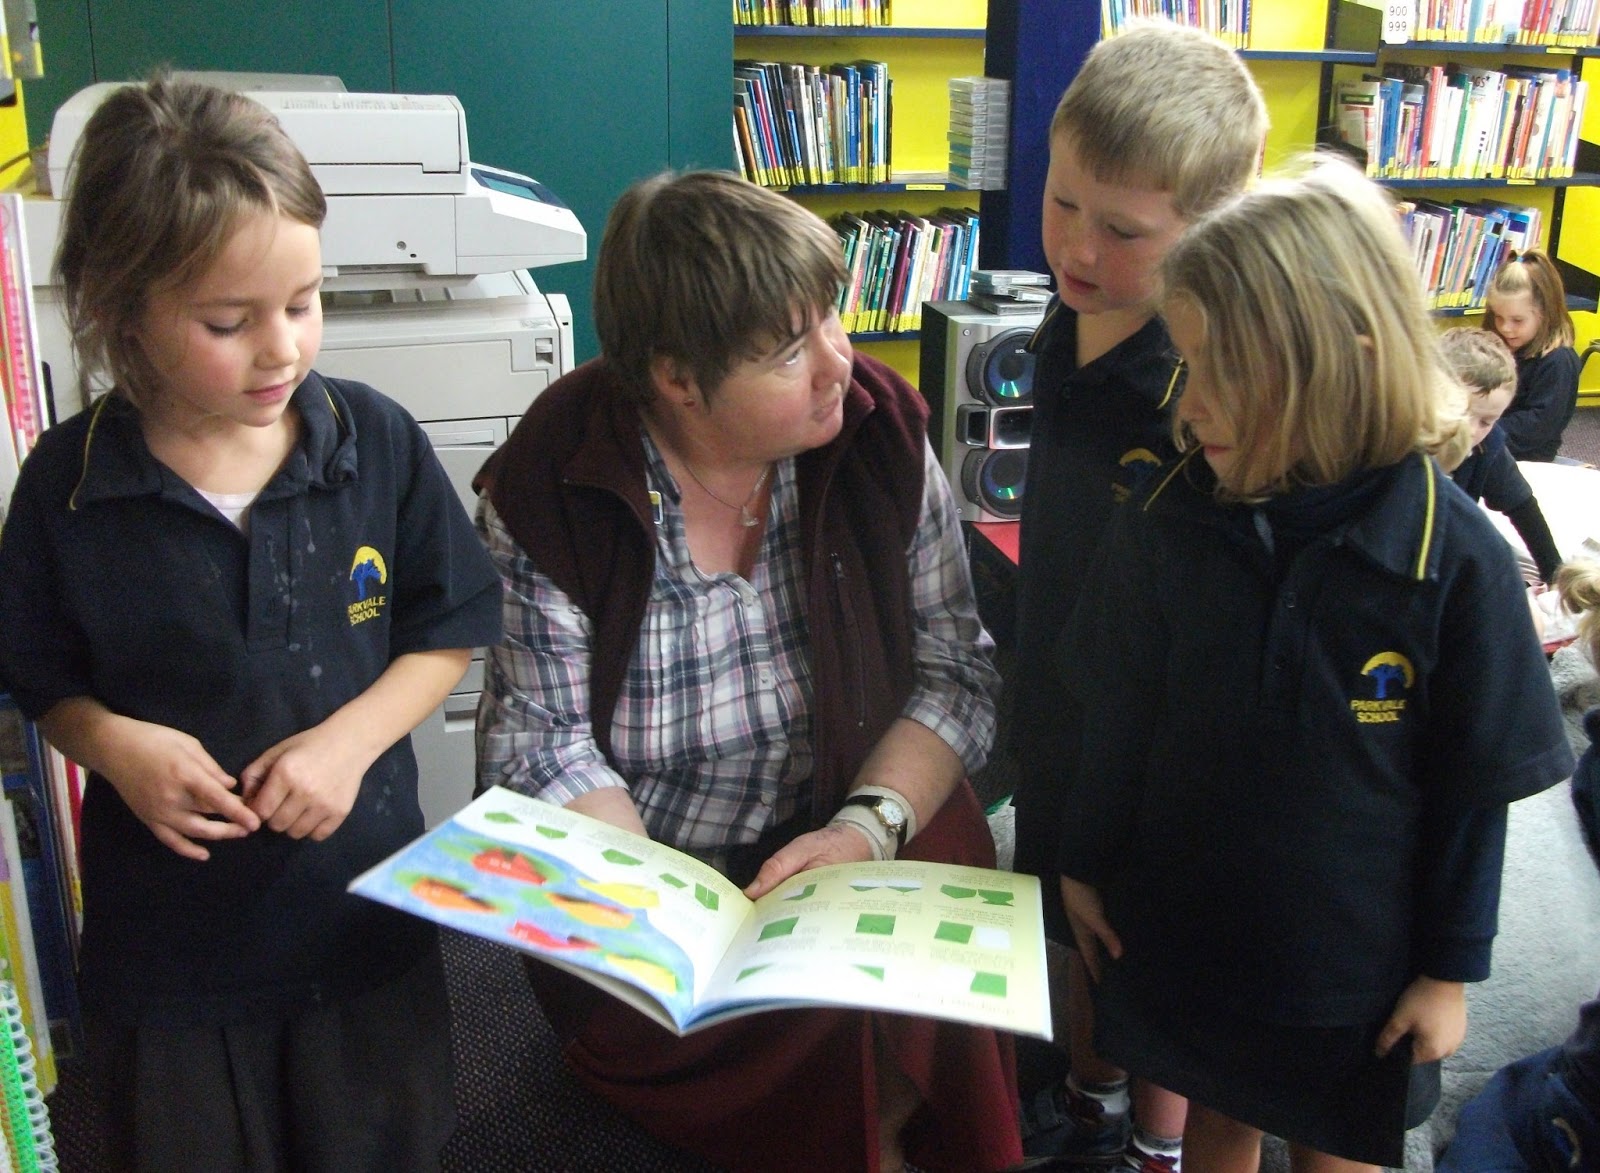
Georgia, Zack and Bailey used the graph to help Miss Sampson choose books for our classroom library shelf.

A water graph.....
We created a water graph to show our favourite colours.
We each chose our favourite colour and used the measuring cup to pour 1/4 of a cup of coloured water into a jar.
We talked about what the graph tells us. We decided that the amount of water in the jars tells us our most and least favourite colours.

Can you answer these questions by looking at the graph..
- What is Room 6s most favourite colour?
- What is Room 6s least favourite colour?
- What else does the graph tell us?

Amazing graphs room 6 From Lucas in room 13
ReplyDelete